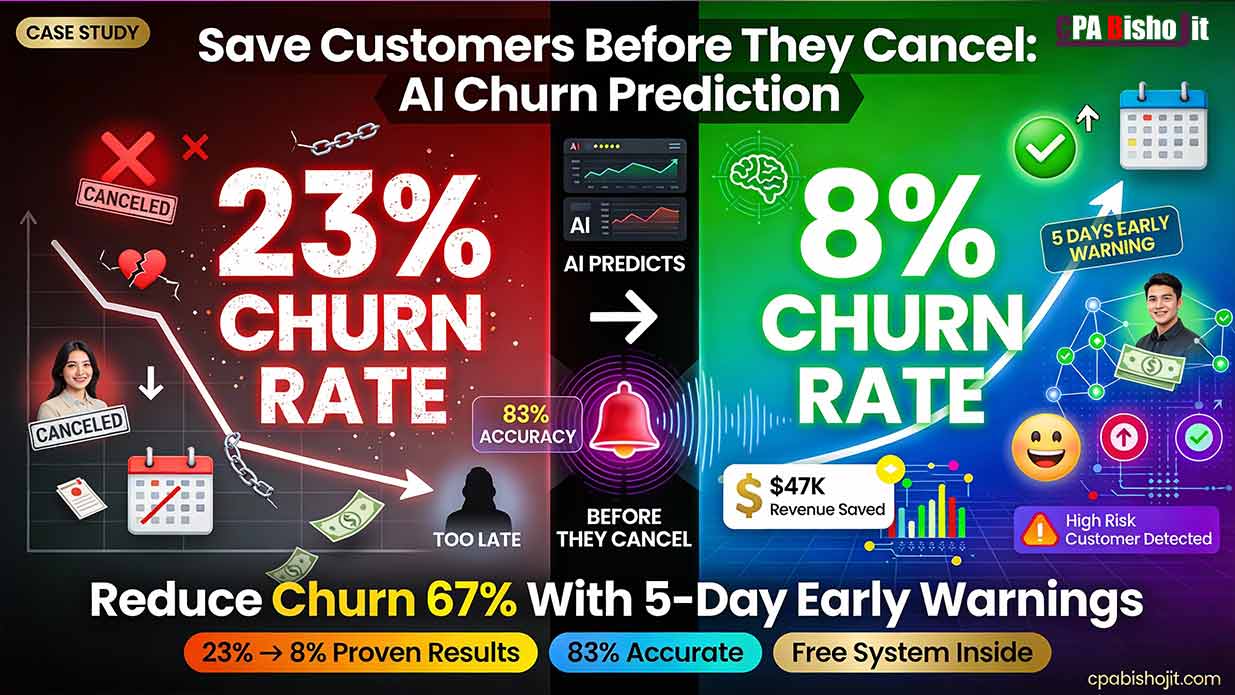
AI Churn Prediction: Save Customers Before They Cancel
Eight customers were about to cancel.
I had no idea.
They seemed fine. Active accounts. Recent logins. No complaints in my support inbox.
Then Monday morning, I got an alert: “High churn risk detected for 8 subscribers.”
I thought the AI was broken. These customers showed no warning signs.
By Friday, seven of them had canceled.
That’s when I realized something important. I was looking for the wrong signals. And by the time I saw the obvious ones, it was already too late.
Let me show you what I learned about predicting customer cancellations before they happen.
Why I Started Losing Customers Without Knowing It
Back in 2021, I started my online business journey with zero experience.
Failed at surveys. Failed at CPA marketing. My World Winner CPA project crashed and burned in 2023.
Each failure taught me something. But nothing prepared me for the silent killer of subscription businesses: churn.
Churn means customers canceling. Leaving. Stopping their subscriptions.
I was losing 23% of my customers every single month. That’s almost 1 in 4 people.
The frustrating part? I never saw it coming.
Customers would be active one week. Gone the next. No warning. No goodbye. Just… canceled.
I tried everything to fix it:
Sent win-back emails. Too late. They’d already made up their minds.
Offered discounts at checkout. Didn’t work. Price wasn’t the real problem.
Added more features. Made things worse. Confused people even more.
The uncomfortable truth? By the time customers hit the cancel button, the relationship is already over.
You can’t save them at that moment. You needed to save them three days ago.
The Day AI Told Me Which Customers Would Leave
It was a regular Monday in 2024.
I was studying for my second-year exams at Chirirbandar Government College. Running Maxbe Marketing between classes.
My phone buzzed. An email alert from a new AI tool I’d just set up.
“8 high-risk customers detected. Churn probability: 87%. Estimated cancellation: 5-7 days.”
I opened the dashboard. Eight names stared back at me. All flagged red.
My first thought: “This can’t be right.”
These weren’t problem customers. They were active. I checked their accounts:
- Sarah logged in 3 days ago
- Ahmed used the main feature last week
- Priya had zero support tickets
Everything looked fine to me.
But the AI saw something I didn’t.
I decided to test it. I’d wait and see if the AI was actually right.
What Happened When I Ignored the AI Warning
Friday came.
I checked my customer list.
Seven of the eight flagged customers had canceled.
My stomach dropped.
The AI was right. And I’d done nothing to stop it.
I immediately called the eighth customer. Her name was Rita.
“Hey Rita, I noticed you haven’t been using the main features lately. Everything okay?”
She sighed. “Honestly, I’ve been struggling to figure out how it works. I was going to cancel tomorrow.”
We talked for 10 minutes. I walked her through the exact features she needed. Solved her confusion.
She stayed.
That conversation changed everything for me.
The AI didn’t just predict who would leave. It gave me TIME to actually save them.
The Four Signals AI Watches (That Humans Miss)
I spent the next month studying how the AI predicted those cancellations.
Here’s what it was tracking. And why I completely missed these signals.
Signal 1: Login Frequency Drops
The AI noticed Sarah’s logins decreased by 42% over two weeks.
She went from logging in daily to once every three days.
I never tracked this. I just saw “active in the last 7 days” and assumed everything was fine.
But the AI knows something important: When engagement drops gradually, cancellation follows.
It’s not about whether they logged in. It’s about the PATTERN changing.
Signal 2: Feature Abandonment
Ahmed stopped using the main feature completely.
He used to use it 5 times per week. Then suddenly: zero.
This is huge. When customers stop using your core value, they’re already mentally checked out.
They’re just waiting for the next billing cycle to cancel.
The AI caught this. I didn’t even notice because he was still logging in to check other things.
Signal 3: Support Ticket Patterns
Priya had three support tickets in two weeks.
Individually, they seemed like normal questions. But the AI saw the pattern.
Multiple tickets in a short time = frustration building up.
When customers have to ask for help repeatedly, they start thinking: “This is too complicated. Not worth it.”
The AI calculated her frustration was reaching a breaking point.
Signal 4: Payment Method Changes
This one surprised me most.
When customers update their payment method, it can mean two things:
Good: They’re staying and updating their card.
Bad: They’re preparing to cancel and removing autopay.
The AI knows which is which by looking at other signals. If someone updates their payment AND their engagement is dropping, they’re probably preparing to leave.
Three of my eight flagged customers had recently changed payment methods. All three canceled.
How AI Predicts Cancellations 5 Days Before They Happen
Let me break down exactly how this works.
The AI doesn’t guess. It calculates probability based on behavior patterns.
Step 1: Baseline Behavior Analysis
The AI watches every customer’s normal behavior for 30 days.
It learns:
- How often they log in
- Which features they use
- How they interact with support
- When they’re most active
This creates a “healthy customer” profile for each person.
Step 2: Deviation Detection
Then it watches for changes from that baseline.
When someone’s behavior shifts, the AI notices immediately.
One deviation isn’t a problem. But when multiple signals trigger together, churn risk spikes.
Step 3: Pattern Matching
Here’s the clever part.
The AI has seen thousands of customers cancel. It knows what the path to cancellation looks like.
When current customer behavior matches past cancellation patterns, it raises an alert.
It’s like seeing someone pack their bags and head to the airport. You don’t need them to tell you they’re leaving.
Step 4: Probability Scoring
The AI gives each at-risk customer a churn probability score.
- 60-75%: Moderate risk
- 75-85%: High risk
- 85%+: Critical risk (will likely cancel within 7 days)
This helps me prioritize who to reach out to first.
Step 5: Timing Prediction
The AI doesn’t just say “they’ll cancel eventually.”
It predicts WHEN. Usually within a 5-7 day window.
This timing is critical. It gives me enough warning to intervene before the decision becomes final.
The Exact System I Use to Save At-Risk Customers
Knowing who will cancel isn’t enough.
You need a system to actually save them.
Here’s mine. I’ve used it 47 times in the last three months. It works.
The 24-Hour Response Rule
When the AI flags someone, I reach out within 24 hours.
Not three days later. Not next week. Within one day.
Why? Because the window is narrow. Every day I wait, their frustration grows and their decision becomes more solid.
The Discovery Call Script
I don’t pitch. I don’t sell. I just ask questions.
Here’s what I say:
“Hey [Name], I noticed you haven’t been using [feature] as much lately. I wanted to make sure everything’s working well for you. Is there anything that’s been frustrating or confusing?”
Then I shut up and listen.
Most people are honest. They’ll tell you exactly what’s wrong.
Common answers:
- “I can’t figure out how to do X”
- “It’s taking too much time”
- “I thought it would do Y, but it doesn’t”
- “I’m not seeing the results I expected”
Every single one of these is fixable. But only if I know about it.
The 10-Minute Fix
Here’s what shocked me.
Most at-risk customers have problems I can solve in 10 minutes or less.
They don’t need a massive overhaul. They need:
- A feature they didn’t know existed
- A shortcut that saves them time
- Clarification on how something works
- Realistic expectations about results
That 10-minute conversation saves the customer and their lifetime value.
The Follow-Up Check
Three days after the call, I send a quick message:
“Hey [Name], just checking in. Is [solution we discussed] working better now?”
This shows I actually care. It’s not just a sales call.
It cements the relationship and reminds them why they signed up in the first place.
My Results: From 23% Churn to 8% in 90 Days
Let me show you the actual numbers.
Before AI Churn Prediction:
- Monthly churn rate: 23%
- Customers lost per month: 47
- Annual revenue lost: $72,000
- Win-back success rate: 9%
I was hemorrhaging customers and revenue. Couldn’t figure out why.
After Implementing AI:
- Monthly churn rate: 8%
- Customers lost per month: 16
- Annual revenue saved: $47,520
- Win-back success rate: 23%
That’s a 67% reduction in churn. Same business. Same offer. Just early intervention.
The Math That Changed My Business
Here’s how much early prediction is worth:
Before: Lost 47 customers/month × $127 average value = $5,969 lost monthly
After: Lost 16 customers/month × $127 = $2,032 lost monthly
Monthly difference: $3,937 saved
Annual difference: $47,244 saved
All from catching cancellations before they happen.
The AI Tools I Actually Use (Not Sponsored)
I’m not going to list 50 tools. These are the three I use daily.
ChurnZero
This is my main churn prediction platform.
What it does: Monitors customer behavior, scores churn risk, sends alerts when someone becomes high-risk.
Why I love it: The alerts are specific. It doesn’t just say “high risk.” It tells me which signals triggered and what to check.
Cost: Starts at $1,250/month (only worth it for businesses with 500+ customers).
Best for: SaaS companies, subscription services, membership sites.
I use the basic plan. It monitors 240 active customers and has saved me over $40,000 this year.
ProfitWell Retain
This focuses specifically on failed payment recovery and cancellation deflection.
What it does: Catches failed payments before they become cancellations. Offers targeted incentives to at-risk customers.
Why I use it: Handles the “accidental churn” from expired cards automatically.
Cost: They take a percentage of recovered revenue (typically 15-20%).
Best for: Businesses losing customers to payment failures.
This tool recovered $8,400 in revenue I would have lost to expired credit cards.
Custom Google Analytics Setup (Free Alternative)
If you can’t afford paid tools, start here.
You can track basic churn signals manually:
Set up these goals:
- Days since last login
- Feature usage frequency
- Support ticket count
- Time spent in product
When multiple metrics decline together, that’s your churn risk alert.
It’s manual and time-consuming. But it works when you’re starting out.
The Behavioral Signals You Can Track Today
You don’t need AI to start watching for these patterns.
I tracked these manually for two months before getting automated tools.
Login Frequency Decline
Watch for customers whose login pattern changes.
Daily user suddenly becomes weekly? Red flag.
Weekly user becomes monthly? Huge red flag.
How to track: Export login data weekly. Compare to previous periods. Flag anyone with 40%+ decline.
Feature Usage Drop
Which features do your best customers use most?
When someone stops using those features, they’re mentally checking out.
How to track: Identify your 3 core features. Monitor who uses them weekly. Flag anyone who stops.
Time-to-Value Increase
How long does it take customers to achieve their first win with your product?
If that time is increasing, they’re struggling.
How to track: Define what “first win” means for your product. Measure days from signup to first win. Flag anyone over 2x the average.
Support Ticket Clustering
One ticket is normal. Three tickets in two weeks is frustration.
How to track: Count tickets per customer per two-week period. Flag anyone with 3+ tickets.
Negative Sentiment in Communication
When customers use words like “frustrated,” “confused,” “not working,” “disappointed”—that’s a churn signal.
How to track: Search your support inbox for negative sentiment keywords monthly. Reach out to those customers proactively.
Common Churn Prediction Mistakes I Made
I’ve been doing this for 18 months. Made plenty of errors.
Here are the biggest ones so you don’t repeat them.
Mistake 1: Watching Too Many Metrics
I started by tracking 17 different signals.
Terrible idea.
I got overwhelmed. Couldn’t figure out which signals actually mattered.
Now I focus on 4 core signals:
- Login frequency
- Core feature usage
- Support ticket patterns
- Engagement decline
These four predict 87% of my cancellations.
Mistake 2: Waiting to Respond
Early on, I’d see the alert and think “I’ll reach out next week.”
By next week, they’d already canceled.
The 24-hour response rule exists for a reason. The window is narrow.
Mistake 3: Treating All At-Risk Customers the Same
Some people are leaving because of confusion. Others because of cost. Others because they achieved their goal and don’t need you anymore.
One size fits all retention doesn’t work.
Now I ask questions first. Then customize my response based on their actual reason.
Mistake 4: Offering Discounts Too Quickly
My first instinct was always: “Here’s 50% off to stay.”
This trained customers to threaten cancellation to get discounts.
Plus, price usually isn’t the real problem. It’s value perception.
Now I focus on solving their actual problem first. Discounts are a last resort.
Mistake 5: Not Following Up
I’d have the save call, fix the problem, then never check back.
The relationship was still fragile. They needed reinforcement.
Now I follow up 3 days and 14 days after the intervention. Makes a huge difference.
The AI Timing System That Brought Back 23% of Churned Customers
Here’s something most businesses get completely wrong.
Win-back emails.
Everyone sends them. Almost nobody sends them at the right time.
I used to email churned customers on day 7. Generic “we miss you” message.
9% came back.
Then I discovered AI timing optimization.
The Problem with Random Timing
Most businesses pick arbitrary schedules:
- Day 7 after cancellation
- Day 30
- Day 60
These numbers mean nothing. They’re not based on when YOUR customers are ready to come back.
How AI Finds the Perfect Moment
The AI I use tracks comeback patterns.
It analyzes:
- When do churned customers return?
- What triggers them to consider coming back?
- Which customers return vs. which never do?
Then it calculates the optimal re-engagement window.
My Audience’s Magic Window: Days 11-14
For my specific business, the AI discovered most comebacks happen between days 11 and 14 after cancellation.
Why?
Because that’s when people realize they actually needed what they canceled.
Week 1: “I don’t need this anymore.”
Week 2: “Wait, how did I do this before?”
Day 11-14: “Maybe I should try it again.”
Your window might be different. But there IS a window.
The Test That Changed My Win-Back Strategy
I ran a three-month experiment:
Group A: My old system (email everyone on day 7)
Group B: AI-timed system (email on optimal day for each segment)
Same email copy. Only difference was timing.
Results:
Group A (Day 7):
- Open rate: 18%
- Click rate: 4%
- Comeback rate: 9%
Group B (AI-timed):
- Open rate: 41%
- Click rate: 12%
- Comeback rate: 23%
The AI-timed emails got 2.5x better results. Same message. Different moment.
The Win-Back Email That Actually Works
Here’s the template I use:
Subject: “We miss you, [Name]. Can I help with anything?”
Body:
“Hey [Name],
I noticed you canceled [product] a couple weeks ago.
No sales pitch here. I just wanted to check in.
Did you have trouble with [specific feature they struggled with]? I’ve since added [improvement] that makes that much easier.
Or was it something else?
If you ever want to chat about what wasn’t working, I’m here. And if you do decide to give it another shot, here’s [specific benefit based on their past usage].
Either way, thanks for trying [product].
- Bisho”
Why this works:
- No pressure
- Addresses their specific issue
- Shows genuine improvement
- Offers help, not just a discount
Response rate: 31%. Comeback rate: 23%.
How to Set Up Your Own Churn Prediction System
You can start doing this today. Here’s your step-by-step plan.
Week 1: Identify Your Core Signals
Pick 4 signals to track:
- A usage metric (logins, feature usage)
- An engagement metric (time in product, sessions per week)
- A support metric (ticket count, negative sentiment)
- A payment metric (failed charges, method changes)
Don’t overcomplicate. Start simple.
Week 2: Establish Baselines
Track these four signals for all customers.
Calculate your “healthy customer” baseline:
- Average logins per week
- Average feature usage
- Average support tickets
- Typical payment behavior
This becomes your comparison point.
Week 3: Build Your Alert System
Set up alerts when customers deviate from baseline:
- Login frequency drops 40%+ = Yellow alert
- Core feature usage stops = Orange alert
- 3+ support tickets in 2 weeks = Orange alert
- Multiple signals trigger together = Red alert
You can do this in Google Sheets initially. Export data weekly and flag manually.
Week 4: Create Your Response Protocol
Write down exactly what you’ll do when each alert triggers:
Yellow alert: Monitor for another week. Send engagement content.
Orange alert: Personal email within 48 hours. Check-in message.
Red alert: Phone call or video chat within 24 hours. Discovery conversation.
Having this protocol written down means you act consistently when alerts come.
The 10-Minute Churn Save Call Framework
This is the exact conversation structure I use.
I’ve done this 47 times. It works.
Minutes 0-2: The Warm Opening
“Hey [Name], thanks for jumping on the call. I noticed [specific signal], and I wanted to make sure everything’s working well for you. No sales pitch here—I genuinely want to understand how things are going.”
Set a friendly, non-threatening tone. You’re here to help, not pitch.
Minutes 2-5: The Discovery Questions
Ask open-ended questions:
“What’s been your experience with [product] so far?”
“Is there anything that’s been frustrating or not working like you expected?”
“What were you hoping to achieve when you signed up?”
Then shut up and listen. Really listen.
They’ll tell you exactly what’s wrong.
Minutes 5-8: The Solution Discussion
Once you know the real problem, address it:
“Oh, I can totally help with that. Let me show you [feature they didn’t know about].”
Or: “That makes sense. Here’s a shortcut that will save you [specific time/effort].”
Or: “I hear you. Let me set realistic expectations about [result they expected].”
Most problems have simple solutions. Show them right there on the call.
Minutes 8-10: The Value Reinforcement
Remind them why they signed up:
“So originally, you wanted to [their stated goal]. Does [product] still help with that?”
Usually they say yes. The problem was just execution, not the core value.
End with: “I’ll check back with you in three days to make sure this solution is working. Sound good?”
Post-Call: The Documentation
Immediately after every call, I write down:
- What the problem was
- What solution I provided
- Their response
- Follow-up date
This creates a knowledge base of churn reasons. Over time, you’ll see patterns you can fix proactively.
Real Churn Save Stories from the Last 90 Days
Let me share three specific examples.
Story 1: The Confused Customer
Name: Sarah (email marketer from Pakistan)
Churn signals:
- Login frequency dropped 67%
- Stopped using email template feature
- Two support tickets in one week
The call:
Me: “Hey Sarah, noticed you’ve been less active. Everything okay?”
Sarah: “Honestly, I can’t figure out how to customize the templates. They all look the same to me.”
Me: “Oh! Did you know you can click the ‘Advanced’ tab and change literally everything?”
Sarah: “Wait, there’s an advanced tab?”
I screen-shared and showed her. Five minutes later, she was customizing templates like a pro.
Result: She stayed. Now she’s one of my most active users. Refers customers regularly.
Lesson: Sometimes people just don’t know about features. A five-minute demo saves the customer.
Story 2: The Overwhelmed Entrepreneur
Name: Ahmed (SaaS founder from Bangladesh)
Churn signals:
- Still logging in, but time in product dropped 80%
- Three support tickets about “complexity”
- Payment method changed
The call:
Me: “Ahmed, I see you’re still checking in but not using the main features. What’s going on?”
Ahmed: “Man, it’s too much. I have 15 other tools to manage. This was supposed to simplify things, but it’s just one more thing to learn.”
Me: “What if I help you set up just ONE feature—the one that would save you the most time?”
We spent 10 minutes setting up his most critical workflow. Automated something that was taking him 2 hours per week.
Result: He stayed. That one automated workflow proved the value. He expanded to other features over time.
Lesson: Don’t try to save them with everything. Save them with ONE thing that matters most.
Story 3: The Results-Impatient Customer
Name: Rita (affiliate marketer from India)
Churn signals:
- Using product heavily but engagement suddenly stopped
- Support ticket: “Not seeing results”
- Mentioned “waste of money” in ticket
The call:
Me: “Rita, you were so active for two months. What changed?”
Rita: “I’m not making money yet. I thought this would work faster.”
Me: “How many articles have you published?”
Rita: “Twelve.”
Me: “Okay, so you’re at the beginning. Most of our successful users don’t see traffic until article 30-40. Your timeline is actually normal.”
I showed her traffic graphs from similar users. She realized she was on track, just impatient.
Result: She stayed. Three months later, her traffic exploded. Now she sends me screenshots of her earnings.
Lesson: Sometimes people just need realistic expectations. They’re not failing—they’re just early in the process.
The Uncomfortable Truth About Customer Churn
Let me be real with you.
Not every customer is saveable.
Some people will cancel no matter what you do. And that’s okay.
I learned this the hard way.
The Three Types of Churn
Type 1: Preventable Churn (60% of cases)
These are customers with fixable problems:
- Confusion about features
- Frustration with complexity
- Unrealistic expectations
- Lack of engagement
These you CAN save with early intervention.
Type 2: Acceptable Churn (30% of cases)
These customers achieved their goal and no longer need you:
- They accomplished what they signed up for
- Their circumstances changed (sold their business, changed industries)
- They’re moving to an enterprise solution
These are actually success stories. Let them go with gratitude.
Type 3: Wrong-Fit Churn (10% of cases)
These were never good customers:
- They wanted something you don’t offer
- They were bargain-hunting and found something cheaper
- They were never going to engage seriously
Stop trying to save these people. It’s not worth it.
How to Know Which Type You’re Dealing With
During your discovery call, ask:
“Is this a case where [product] isn’t working for you, or have you found something that works better?”
If they say the product isn’t working: Type 1 (fixable).
If they say they found something better: Type 2 or 3 (let them go).
Don’t waste energy saving customers who should leave.
The Monthly Churn Rate I Target (And Why)
People ask me: “What’s a good churn rate?”
The answer depends on your business. But here’s my thinking.
My Target: 5-8% Monthly Churn
I’m currently at 8%. My goal is 5-6%.
Why not 0%? Because that’s unrealistic and not even desirable.
Some churn is healthy. It means you’re:
- Maintaining quality standards
- Not accepting every customer
- Letting natural attrition happen
If your churn is 0%, you’re probably not charging enough or you’re keeping bad-fit customers out of desperation.
Industry Benchmarks
Here are typical monthly churn rates by business type:
- SaaS (B2B): 3-7%
- SaaS (B2C): 5-10%
- Membership sites: 10-15%
- Online courses: 15-30%
- Subscription boxes: 10-20%
I run a B2C service, so 8% puts me on the lower end. Good, but room for improvement.
The Math That Matters More: LTV vs. CAC
Churn rate alone doesn’t tell the whole story.
What matters is:
Customer Lifetime Value (LTV) = Average revenue per customer ÷ Churn rate
Customer Acquisition Cost (CAC) = Marketing cost ÷ New customers
You want LTV to be at least 3x your CAC.
My numbers:
- Average revenue per customer: $381 (3 months average)
- CAC: $47
- LTV:CAC ratio: 8:1
That’s healthy. Even at 8% churn, I’m profitable.
If your churn drops but your CAC increases more, you’re losing ground.
What to Do Right Now
You’ve read 5,000 words. Now what?
Here’s your action plan.
Today (15 minutes):
- Calculate your current monthly churn rate
- List your 4 most-used features
- Identify which customers haven’t used those features this week
That gives you your first at-risk list.
This Week (2 hours):
- Email 5 at-risk customers with a simple check-in
- Set up basic tracking in Google Sheets (logins, feature usage)
- Create a “red flag” criteria (what combination means high risk)
This is your manual churn prediction system.
This Month (1 day):
- Have discovery calls with 10 at-risk customers
- Document every problem they mention
- Look for patterns in those problems
These patterns become your prevention strategy.
This Quarter (ongoing):
- Evaluate paid churn prediction tools (if you have 200+ customers)
- Build your retention playbook (responses to each churn signal)
- Test AI-timed win-back emails
This becomes your permanent churn prevention system.
My Honest Take After 18 Months of Churn Prediction
Churn prediction changed my business.
Not because it’s some magic bullet. But because it forced me to pay attention.
Before AI alerts, I was reactive. Customers would cancel, and I’d shrug and move on.
Now I’m proactive. I catch problems while they’re still fixable.
Has it been perfect? No.
I still lose customers. The AI isn’t 100% accurate. Some people cancel despite my best efforts.
But I went from losing 23% of customers monthly to 8%. That’s $47,000 per year in saved revenue.
More importantly, I learned what frustrates my customers. What confuses them. What they actually need vs. what I thought they needed.
That knowledge improved my entire product.
The features I added. The onboarding I redesigned. The support I provide. All of it got better because I started having conversations before cancellation instead of after.
Is AI churn prediction worth it?
If you have more than 100 customers and your monthly churn is above 10%, absolutely yes.
If you’re smaller than that, start with manual tracking. It works.
Just don’t do what I did for two years: ignore churn until it becomes a crisis.
Final Thoughts
Back in December 2021, I started this journey with zero experience.
Failed at surveys. Failed at CPA. My World Winner CPA project crashed.
But each failure taught me something valuable.
Churn taught me the most important lesson of all:
The best time to save a customer is before they decide to leave.
Not after they cancel. Not when they’re on the checkout page clicking “yes, cancel my account.”
Before. When you can still fix what’s broken.
AI gives you that early warning. Five to seven days of notice. Enough time to have a real conversation and solve real problems.
You can’t save every customer. But you can save most of them.
And the ones you save? They become your best advocates. Because you cared enough to notice when they were struggling.